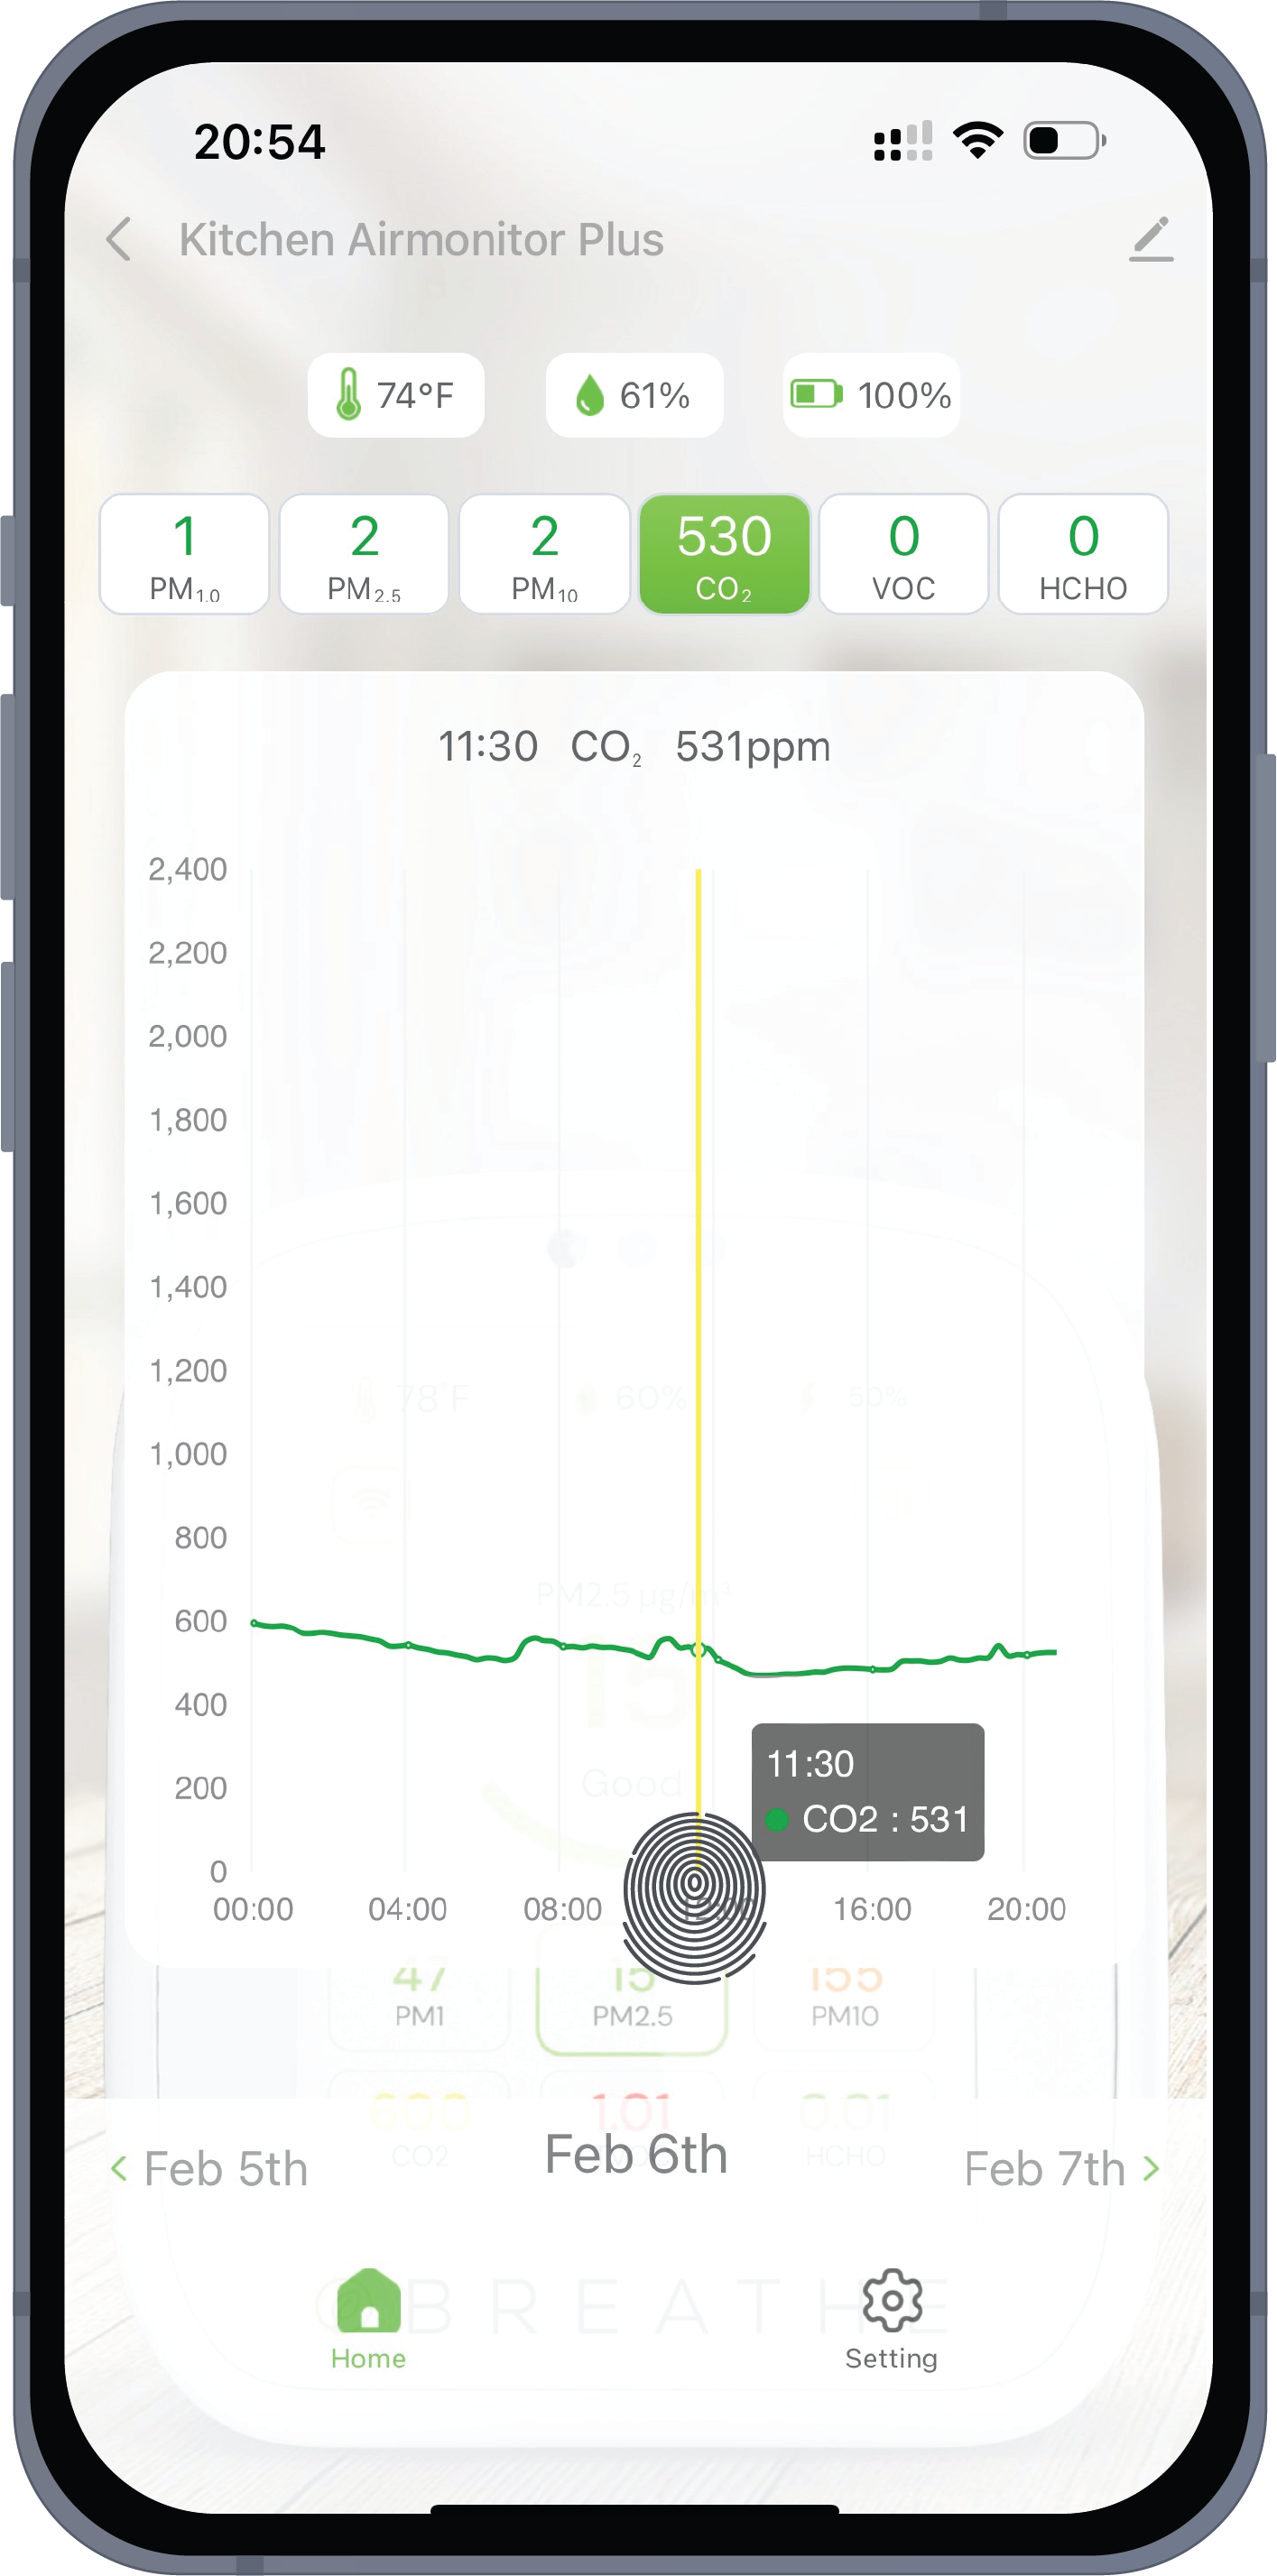
The Breathe Tech app allows you to view the exact value and timestamp for every recorded data point on your historical graphs.
This makes it easy to see precisely when air quality changed and understand what may have caused it.
View Individual Data Points
- Open the Breathe Tech app.
- Select your Airmonitor Plus.
- Select the air quality parameter you want to view (such as CO₂, PM2.5 or Temperature).
- Touch and hold anywhere on the graph.
- Drag your finger left or right to move between recorded data points.
As you move across the graph, the app displays the exact reading, along with the date and time it was recorded.
Why Is This Useful?
Viewing individual data points helps you:
- Identify exactly when air quality changed.
- Compare readings throughout the day.
- See the effect of activities such as cooking, cleaning or opening a window.
- Review historical readings before exporting your data.
Frequently Asked Questions
Can I see the exact reading for every point on the graph?
Yes. Simply touch and hold the graph, then drag your finger across it to display the value and timestamp for each recorded data point.
Can I export the data shown on the graph?
Yes. The Breathe Tech app allows you to export up to 90 days of historical data as a CSV file for further analysis.
Why don't I see any data points?
If the graph is empty, please refer to Why Don't I See Data Plotted on the Graph? for troubleshooting steps.
Was this article helpful?
That’s Great!
Thank you for your feedback
Sorry! We couldn't be helpful
Thank you for your feedback
Feedback sent
We appreciate your effort and will try to fix the article